Wipro Ltd is currently demonstrating a positive trajectory, both in the short term and long term. Here’s a detailed description:
Overview of Wipro Ltd
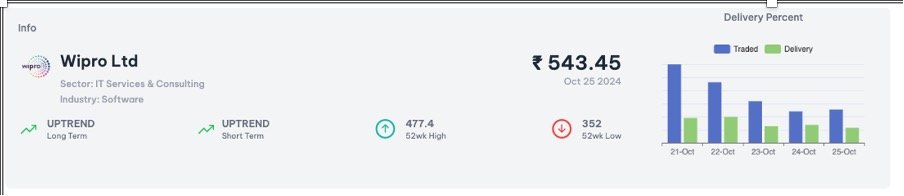
- Long-term Trend: Up
- Wipro has shown consistent growth over an extended period, reflecting strong fundamentals and strategic initiatives that have bolstered its market position. This upward trend indicates investor confidence and potential for future expansion.
- Short-term Trend: Up
- In the recent months, Wipro’s stock has experienced upward momentum, likely driven by favourable earnings reports, new contracts, or market developments. This short-term uptrend suggests that the company is capitalizing on current market conditions effectively.
- Noticeable Demand
- There has been a marked increase in demand for Wipro’s services, possibly due to trends in digital transformation, cloud computing, and IT services. This heightened demand may stem from the company’s ability to adapt to evolving technology needs and client requirements.
- Out-performing Benchmark
- Wipro has been outpacing major benchmarks, indicating that it is delivering better returns compared to its peers or broader market indices. This performance may reflect the company’s competitive advantages, operational efficiencies, or strategic investments.
Good Basic Fundamentals
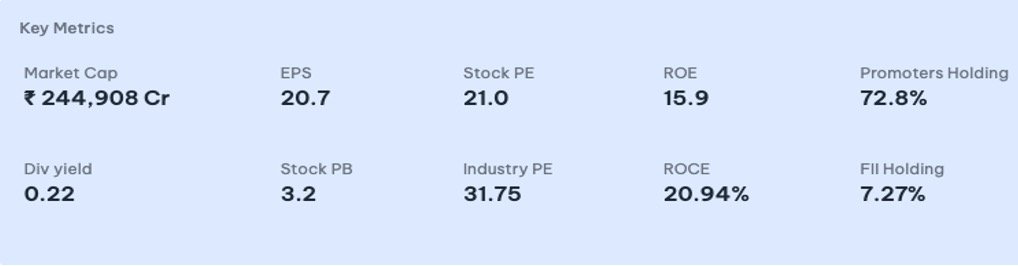
- Price-to-Earnings (P/E) Ratio
- Wipro’s stock P/E ratio is lower than the industry average, indicating that the stock may be undervalued relative to its peers. This suggests that there is potential for upward movement as the market corrects this discrepancy.
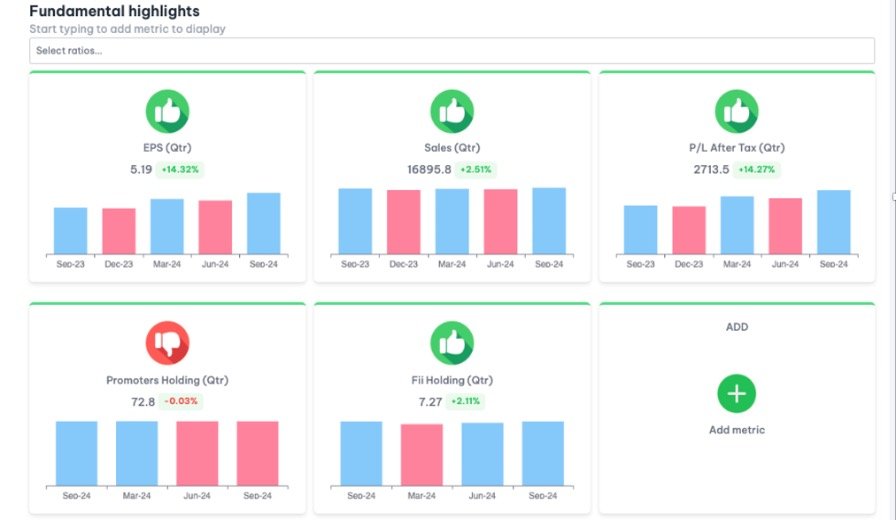
- Improving Quarterly Results
- The company reported positive results for Q2 FY24, reflecting improved operational performance. Consistent improvements in quarterly results can enhance investor confidence and support further stock appreciation.
- High Management Efficiency
- Wipro boasts a high Return on Equity (ROE) of 17.30%. This metric indicates effective management and a strong ability to generate profits from shareholder equity, reinforcing investor trust in the company’s leadership and operational strategies.
- Operating Profit to Net Sales
- The operating profit margin reached its highest at 20.19%, showcasing Wipro’s ability to convert sales into profits efficiently. A strong operating margin indicates effective cost management and pricing strategies.
- Low Debt-to-Equity Ratio
- Wipro maintains an average debt-to-equity ratio of 0 times, signifying a conservative approach to financing and a strong balance sheet. This low level of debt reduces financial risk and provides the company with greater flexibility to invest in growth initiatives.
Technical Analysis of Wipro Ltd: A Bullish Outlook
Wipro Ltd is showing promising technical indication, positioning it as a strong candidate for investors. The stock is currently on an upward trajectory, characterized by key patterns and metrics that suggest continued growth.

Bullish Patterns: Higher Lows and Higher Highs
One of the most compelling features of Wipro’s price action is its formation of higher lows and higher highs. This consistent upward movement reflects increasing investor confidence and buying pressure. Such patterns are indicative of a robust uptrend, suggesting that the stock has the potential to continue its ascent.
Trading Above Key Moving Averages
Wipro is trading above its key moving averages, including the Long-terms and Short-term moving averages. This is a critical technical signal; when a stock trades above these averages, it indicates strong bullish momentum. These moving averages often serve as dynamic support levels, and remaining above them reinforces the positive sentiment surrounding the stock.
Volume Trends
Volume plays a critical role in confirming price movements. Wipro has been experiencing increased delivery volume alongside price increases, indicating robust investor interest. Higher volume during price advances suggests conviction in the uptrend, further solidifying the stock’s bullish outlook.
Supply Vs Demands
· 6-Month Demand vs. Supply (1.38x):
- This indicates that demand is still higher than supply, but the ratio suggests a more stable market condition. The lower ratio compared to shorter terms may indicate a gradual normalization or a slowing growth trend.
· 3-Month Demand vs. Supply (1.06x):
- A stronger demand compared to the 6-month trend, suggesting a recent increase in interest or need for the company’s services/products. This could be due to seasonal factors or recent developments in the company or industry.
· 1-Month Demand vs. Supply (0.78x): This high ratio indicates a significant spike in demand compared to supply, suggesting that in the short term, there’s strong investor interest or market conditions favouring the company.
No responses yet