
Overview
Jubilant Pharmova Ltd has been exhibiting a strong performance in both long-term and short-term trends, indicating a positive outlook for the company.

Long-term Trend: Up
The long-term trend for Jubiland Pharmova Ltd shows a consistent upward trajectory. This trend is supported by several factors:
- Market Position: As a prominent player in the healthcare sector, Jubiland Pharmova Ltd has established a robust presence across multiple regions,
- Expansion Initiatives: Ongoing efforts to expand its healthcare services and facilities contribute to its growth potential.
Short-term Trend: Up
In the short term, Jubiland Pharmova Ltd continues to perform well, driven by:
- Increased Demand: There has been noticeable demand for healthcare services post-pandemic, leading to higher patient footfall and revenue.
- Innovative Services: The introduction of telemedicine and other digital health services has enhanced patient access and engagement.
Demand and Performance
Jubiland Pharmova Ltd is out-performing its benchmark, which can be attributed to:
- Financial Performance: Recent financial reports indicate strong revenue growth and improved profitability metrics, surpassing industry averages.
- Strategic Partnerships: Collaborations with other healthcare providers and technology firms enhance service offerings and operational efficiencies.
Valuation Metrics Stock PE vs. Industry PE:
Jubiland Pharmova’s PE ratio is lower than the industry average, indicating that the stock is undervalued relative to its peers. This gap suggests that there is ample room for price appreciation as the market corrects this valuation discrepancy.
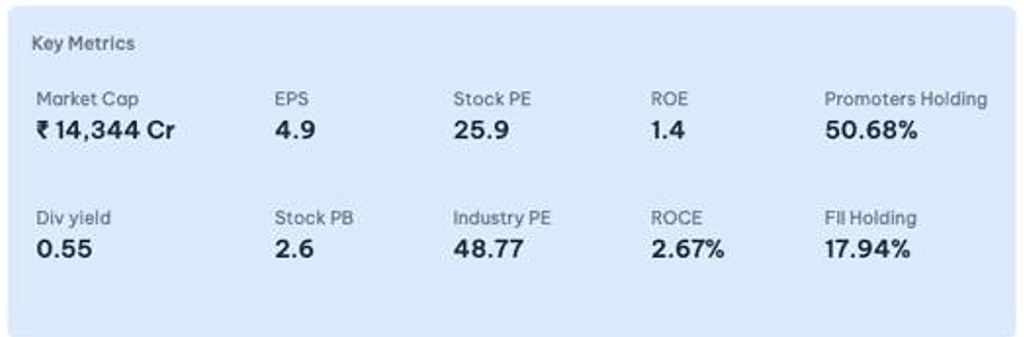
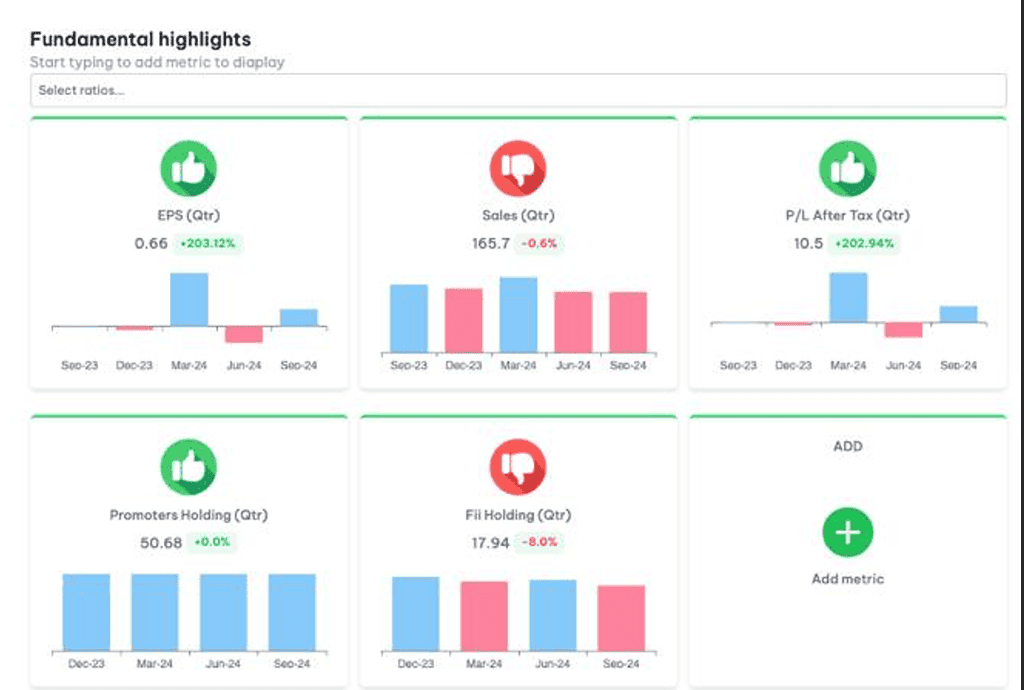
Quarterly Performance:
- PAT (Profit After Tax): In the September 2024 quarter, Jubilant Pharmova Ltd reported a PAT of ₹10.5 crore, reflecting a remarkable growth of 200%+ year-on-year. This substantial increase underscores the company’s ability to enhance profitability significantly.
- Operating Profit to Interest Ratio: The operating profit to interest ratio reached an impressive 15%, indicating robust earnings relative to interest obligations. This metric suggests financial stability and a strong ability to service debt.
- Operating Profit to Net Sales:
The operating profit margin stands at 20.23%, the highest recorded, showcasing Jubilant Pharmova Ltd’s efficiency in converting sales into profits. A higher operating margin is a positive sign of the company’s cost management and pricing strategies. - Return on Capital Employed (ROCE):
With a ROCE of 2.6%, Jubilant Pharmova Ltd demon strates an effective use of capital in generating profits.
Technical Analysis of Aster JUBLPHARMA: Jubilant Pharmova Ltd: A Bullish Outlook
JUBLPHARMA: Jubilant Pharmova Ltd is showing promising technical indication, positioning it as a strong candidate for investors. The stock is currently on an upward trajectory, characterized by key patterns and metrics that suggest continued growth.
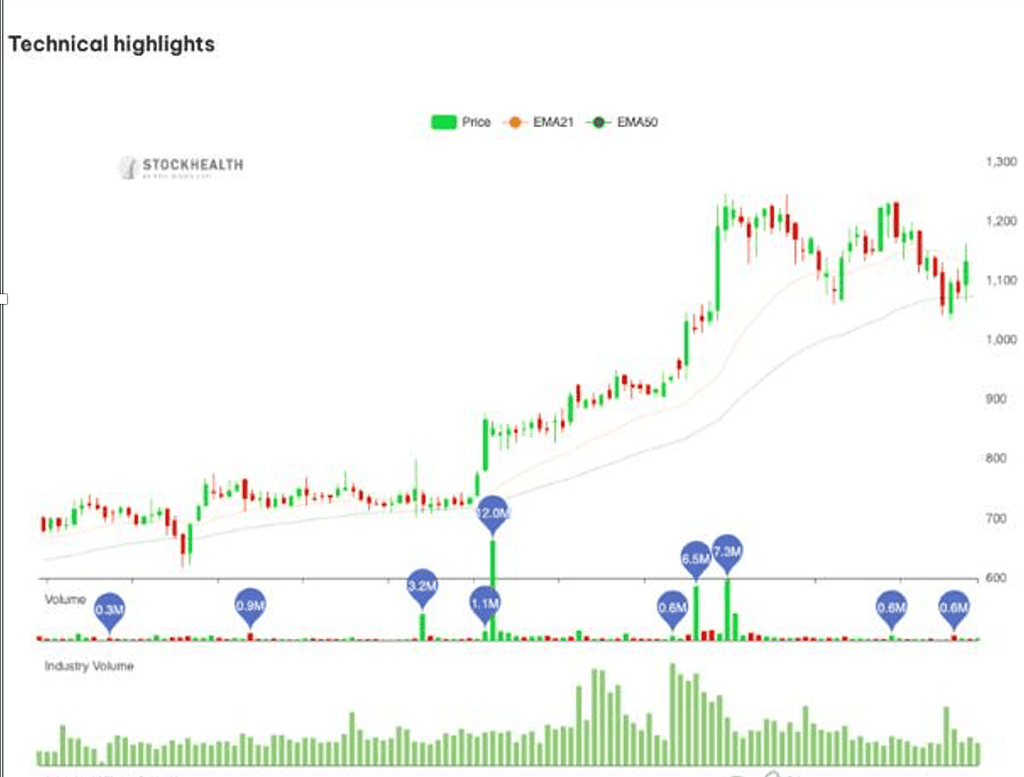
Bullish Patterns: Higher Lows and Higher Highs
One of the most compelling features of Jubilant Pharmova Ltd’s price action is its formation of higher lows and higher highs. This consistent upward movement reflects increasing investor confidence and buying pressure. Such patterns are indicative of a robust uptrend, suggesting that the stock has the potential to continue its ascent.
Trading Above Key Moving Averages
Jubilant Pharmova Ltd is trading above its key moving averages, including the Long-terms and Short-term moving averages. This is a critical technical signal; when a stock trades above these averages, it indicates strong bullish momentum. These moving averages often serve as dynamic support levels, and remaining above them reinforces the positive sentiment surrounding the stock.
Volume Trends
Volume plays a critical role in confirming price movements. Jubilant Pharmova Ltd has been experiencing increased delivery volume alongside price increases, indicating robust investor interest. Higher volume during price advances suggests conviction in the uptrend, further solidifying the stock’s bullish outlook.
Supply Vs Demands
6-Month Demand vs. Supply (7.98x):
- This indicates that demand is still higher than supply, but the ratio suggests a more stable market condition. The lower ratio compared to shorter terms may indicate a gradual normalization or a slowing growth trend.
3-Month Demand vs. Supply (3.16x):
- A stronger demand compared to the 6-month trend, suggesting a recent increase in interest or need for the company’s services/products. This could be due to seasonal factors or recent developments in the company or industry.
1-Month Demand vs. Supply (5.46x): This high ratio indicates a significant spike in demand compared to supply, suggesting that in the short term, there’s strong investor interest or market conditions favouring the company.
No responses yet